Download PDF
You can download the information on this page and the available downloads as one PDF file.
Enter your email address once to gain access to all downloads on the PEO website.
Filter the products and categories by showing only certain partners.
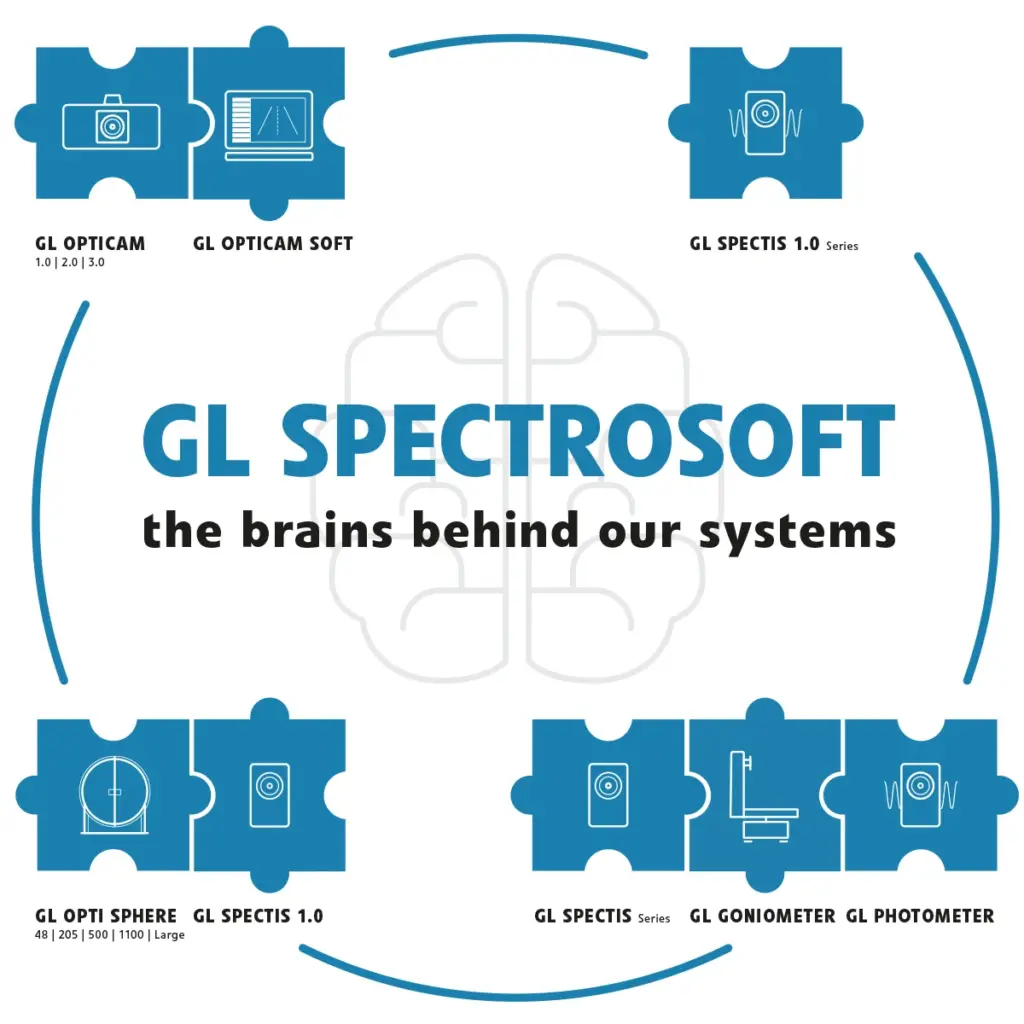
A modular PC-based analysis program called GL SPECTROSOFT M is intended for use in field operations, laboratories, production quality control, and general light assessment. GL SPECTROSOFT M gives your GL SpecTROMETER more strength, speed, and efficiency with a variety of potent add-ons. Whether comparing lighting settings, reviewing field measurements, or assisting with production quality control, this adaptable software platform offers instant access to all pertinent data.
GL SPECTROSOFT M, specifically designed light measuring software for GL Optic’s measurement device, is “the key” to all of the spectrometers’ advanced features. It transforms unprocessed device data into insightful knowledge. The program presents data in both graphical charts that are simple to understand and well-presented, customisable windows (tables). To make the presentation and sharing of data easier, advanced capabilities include structured reporting formats and adjustable pass/fail criteria. All systems come with Spectrosoft Connect; other versions are optional.


Parameters like CCT, chromaticity error, peak wavelength, dominant wavelength, CRI, color coordinate values in accordance with CIE standards, ISO, metamerism index, PAR, PPF, PPFD, photobiological safety, binning, MacAdam ellipses, and many more should be calculated, assessed, presented, or reported.
The days of exporting data to Excel and using it for data crunching are over thanks to a wide selection of analysis, automation, and reporting applications. The features, which include color mixing, pass/fail, relative comparisons, and more, go beyond “standard” spectrum analysis. Even better, it interacts with CAD to make field audits easier.
Even though the best-in-class analysis and automation capabilities of the GL SPECTROSOFT M light measuring software are already provided, we continue to add new features and tools on a regular basis. We provide the measurements and resources lighting professionals require while also adapting to the ever-changing market.
Parameters like CCT, chromaticity error, peak wavelength, dominant wavelength, CRI, color coordinate values in accordance with CIE standards, ISO, Metamerism Index, PAR, PPF, PPFD, photobiological safety, binning, MacAdam ellipses, and much more can be computed, evaluated, presented, or reported using GL SPECTROSOFT M.
With the help of this light measurement software, a user can experiment with the data they have collected. They can test the data (PAS/FAIL, for example), analyze it using CIE, ISO, and other international standards, compare it to other data (reference window), and perform calculations using various parameters (e.g., counting luminous intensity values).
With GL SPECTROSOFT M, integrating sphere or goniometer systems is as simple as plugging in and using any of our spectrometers. Our products are made to grow with your company and do away with the needless learning curves that come with switching software.
The user can be confident that the program is displaying absolute values because GL SPECTROSOFT consistently uses the appropriate calibration file for the instruments (the software detects a unique coded system held in the measurement adapters) (e.g., the measurement made with the sets GL SPECTIS 1.0 and GL OPTI SPHERE shows values of luminous flux in lumens).
Our robust light measurement software has a great deal of configurable options that can be tailored to the needs of the customer. For example, you can build your own report template, choose from a variety of parameters that are always available in the quick window “selected results,” or customize the layout to suit your needs.
Every measurement value is kept on file and is always accessible for comparison with fresh measurements. To share files with your team or clients, save them locally in our file format or export them to Word or Excel.
The LED market and its standards are always evolving, so why shouldn’t the equipment you use? We continue to make significant investments in our development and uphold strong ties with the standards and market committees in order to provide our clients with comprehensive light measuring solutions.
You can download the information on this page and the available downloads as one PDF file.
Enter your email address once to gain access to all downloads on the PEO website.
Choose your cookie preferences. To provide the best experiences, we use cookies, among other things, to store and/or access device information. By consenting to these cookies we can process certain data on this site. If you do not give permission, this may have a negative effect on the operation.