GL SPECTROSOFT M is a modular, PC-based analytical software designed for laboratory applications, field work, production quality control and for general light assessment purposes. With a range of powerful add ons, GL SPECTROSOFT M adds power, speed and efficiency to your GL SPECTROMETER. Whether analyzing field measurements, comparing lighting scenarios, or supporting production quality control, this versatile software platform provides quick access to all important information.
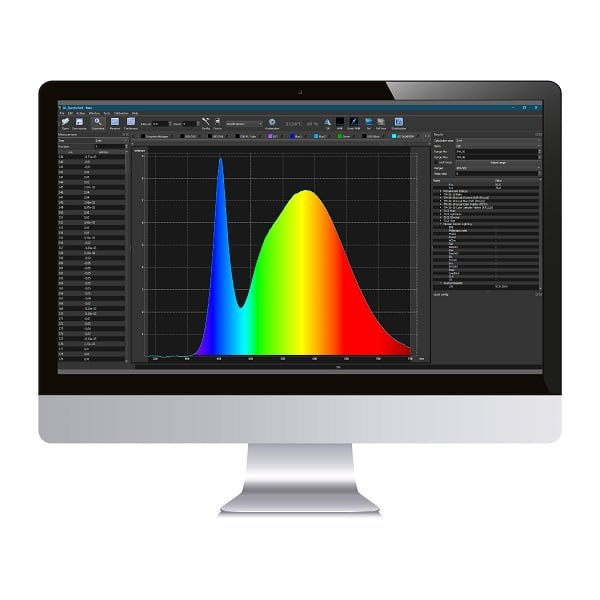
As purpose built light measurement software written for GL Optic’s measurement instrument, GL SPECTROSOFT M is “the key” for all the advanced features of the spectrometers. It turns raw data from devices into powerful information. The software provides data in well presented and customizable windows (tables) and also in an easy to interpret graphical charts. Advanced features include configurable pass/fail criteria and structured reporting formats to simplify presentation and sharing of results. Spectrosoft Connect is included with all systems, other versions optional.
Calculate, evaluate, present or report such parameters as: CCT, chromaticity error, peak wavelength, dominant wavelength, CRI, color coordinate values according to CIE standards, ISO, metamerism index, PAR, PPF, PPFD, photobiological safety, binning, MacAdam ellipses and much more.
With an extensive range of analysis, automation and reporting tools, the days of exporting data to excel to crunch data are over. The tools go beyond “standard” spectral analysis with options like color mixing, pass/fail, relative comparisons and more. It even integrates with CAD for simplified field audits.
GL SPECTROSOFT M light measurement software already offers best in class analysis and automation capabilities, but that doesn’t stop us from implementing new features and tools regularly. We adapt to the changing industry and deliver the metrics and tools lighting professionals need.
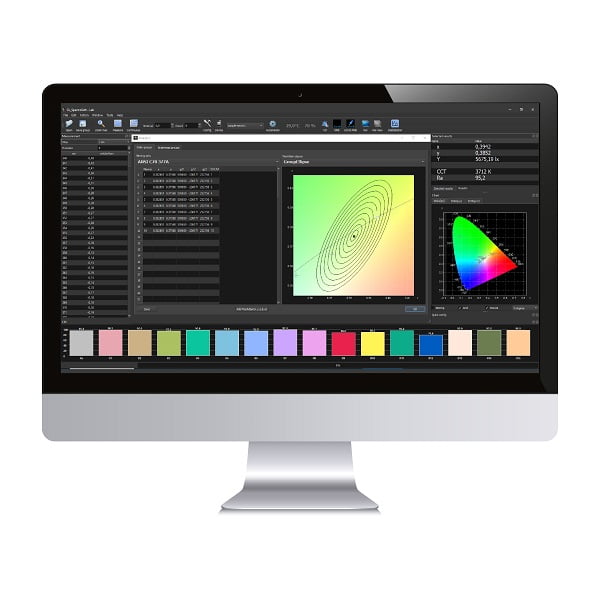
GL SPECTROSOFT M can calculate, evaluate, present or report such parameters as: CCT, chromaticity error, peak wavelength, dominant wavelength, CRI, color coordinate values according to CIE standards, ISO, Metamerism Index, PAR, PPF, PPFD, photobiological safety, binning, MacAdam ellipses and much more…
This light measurement software gives a user the opportunity to experiment using collected data: to test them (e.g. PAS/FAIL), to analyze them according to international standards (CIE, ISO etc.), compare them with other data (reference window) and make calculations using different parameters (e.g. counting luminous intensity values).
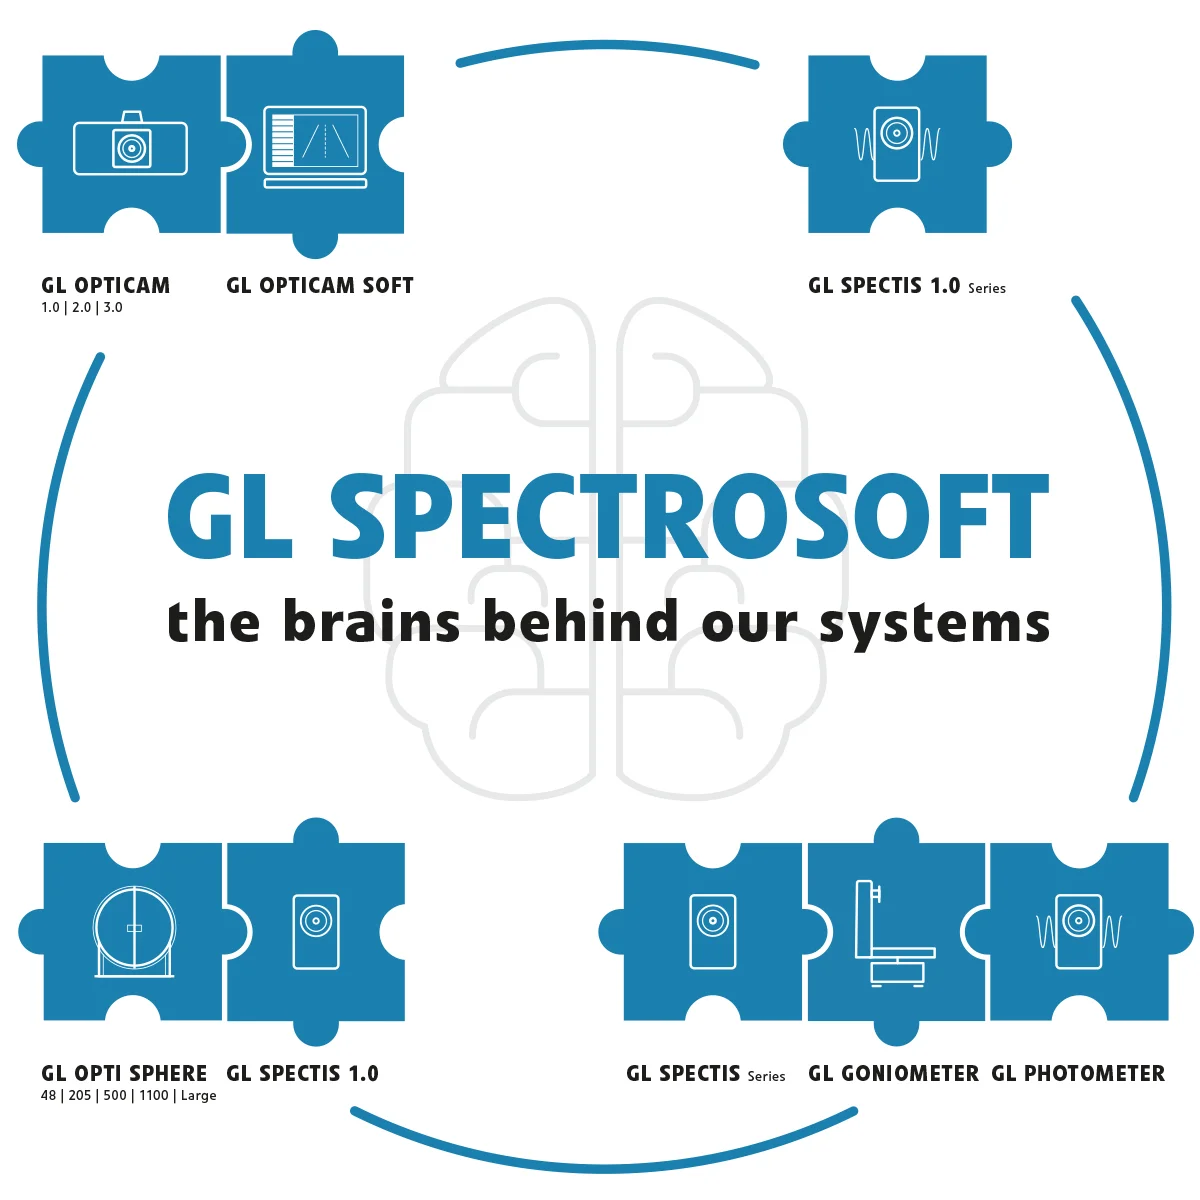
GL SPECTROSOFT M works as a plug-and-play tool for all our spectrometers, integrating sphere systems or goniometer systems. Our solutions are designed to scale with your business and eliminate unnecessary learning curves that come with changing software.
Software’s calculations:
- New color rendering metrics: IES TM-30-15 and new CIE 224:2017 Color Fidelity Index Rf
- Human-centric lighting evaluation metrics: EML (Equivalent Melanopic Lux) and M/P Ratio (Melanopic Photopic Ratio)
- Colorimetric values: xy chromaticity, peak wavelength, dominant wavelength, purity, color rendering, correlated color temperature, CRI index, MacAdam Ellipses and Metamerism Index.
- Photosynthetic active radiation PAR 400–700 [μmol], PPF [μmol/s], PPFD [μmol/m2/s] and PBAR 350–800 nm
- Photobiological safety includes risk groups assessment wizard and detailed values, including irradiance EB, EBK, ES, EUVA, EUV, EIR Eskin and effective radiance values like LB, LIRA and LVISIRA.
- Radiometric values: irradiance [W/m2 nm], radiance [W/cm2 sr nm], radiant power [W/nm] and radiant intensity [W/sr nm]
- Photometric values: luminance [cd/m2], illuminance [lux], luminous intensity [cd] and luminous flux [lm]
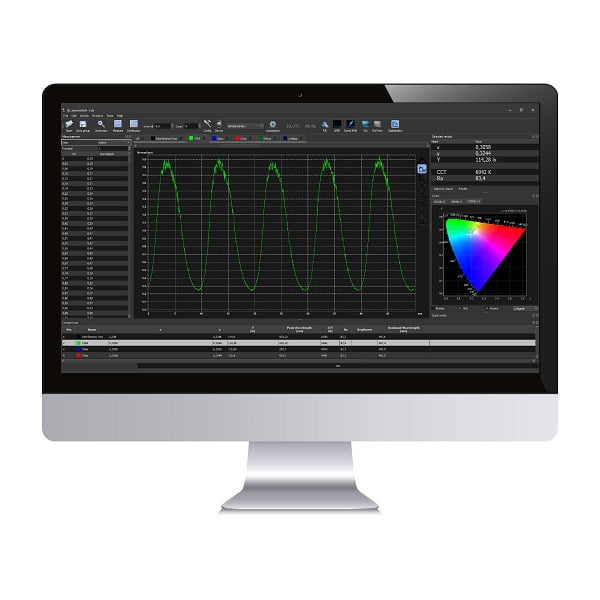
- Flicker frequency,
- Flicker index
- Flicker ratio
- SVM (Stroboscopic Visibility Measure)
- Flicker graph and FFT graphs are available
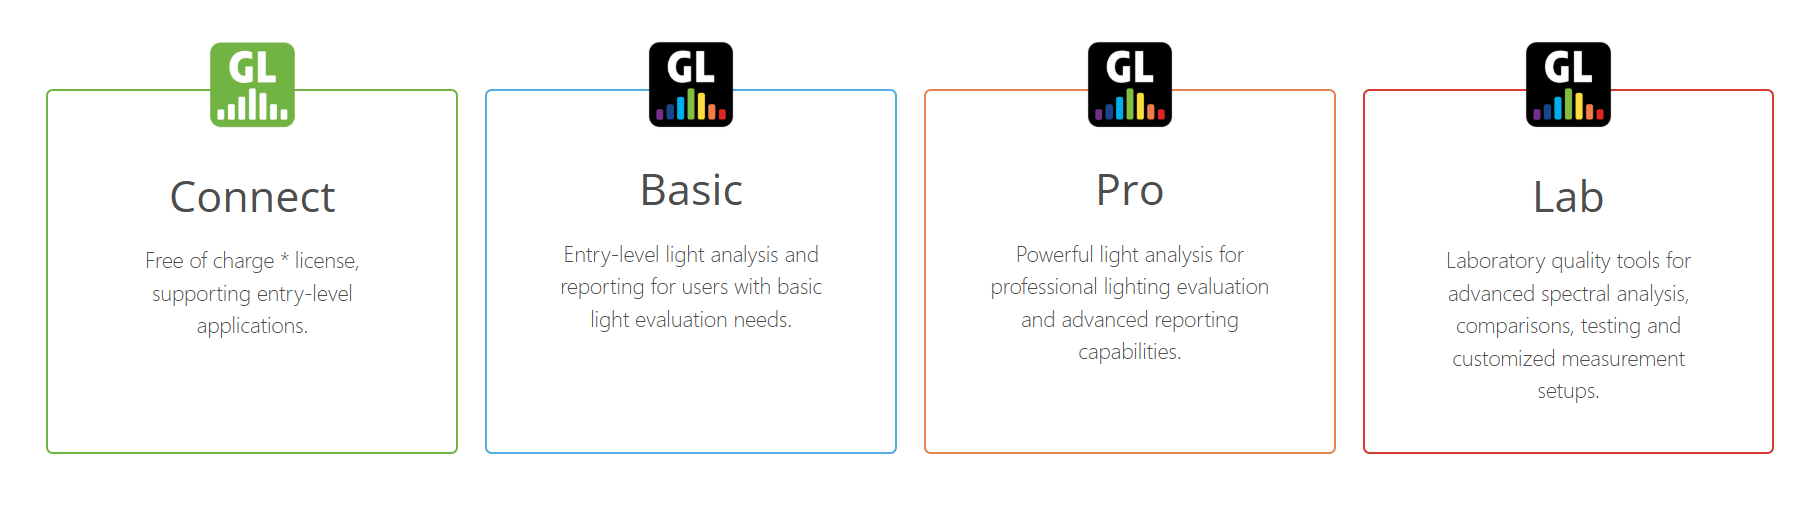
Software levels:
GL SPECTROSOFT M is a complete software suite to analyze, interpret and present your results. Choose the license level suitable for your needs.
Key Features:
- Seamless OS integration for spectrometers, optical spheres, and probes
- Automatic calibration file recognition via coded adapters for absolute values (e.g., lumens with GL SPECTIS 1.0 and GL OPTI SPHERE)
- Extensive configurability: customizable quick results, report templates, and layouts
- Full data storage for comparisons; export to Excel/Word
- Continuous updates aligned with evolving LED market and standards
For more information, simply complete the contact form, and a member of our team will be in touch shortly.